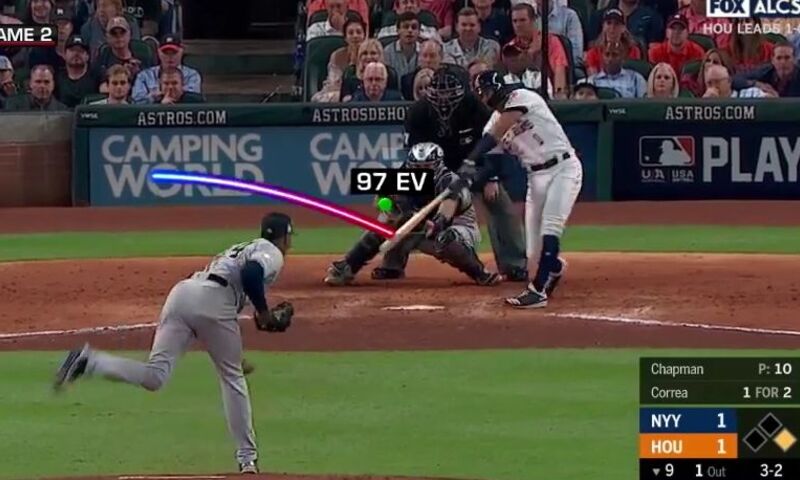
In the spring of 2022, a team of undergraduates in Biola University's Statistical Consulting Practicum built a custom function. The inputs were release speed, release location, and strike zone coordinates for every pitch in Major League Baseball (MLB) from 2017 to 2021. The output was a single value expressed in effective velocity miles per hour (EvMPH), capturing not how fast a pitch was thrown but how fast a hitter's brain had to process it. They ran that function across 3.2 million pitches.
Their assignment was to independently evaluate two central claims of Perry Husband's Effective Velocity (EV) theory. Husband built EV from a single observation about perception: pitch speed is not what a hitter perceives. Where the ball crosses the plate changes how much time a hitter has to react. An inside pitch at 90 mph forces a decision in less time than an outside pitch at the same speed, because the hitter has less distance to cover and less margin to adjust. Effective Velocity formalizes that perceptual gap, adjusting each pitch's raw speed by its location in the strike zone to produce an EvMPH value. From that foundation, Husband identified two patterns in the data: a speed range where hitters make their best contact, and a pitch-sequencing rule that predicts when hard contact is most likely to result. Learn more at effectivevelocity.com.
At the time the Biola team began, no one had run an independent verification of both hypotheses using game-level data at this scale.
The Two Hypotheses
The first hypothesis was the attention zone: hitter performance peaks in a specific EvMPH range. When pitches fall in that band, hitters are timing the ball at their best. On either side of it, performance drops. The second hypothesis concerned the EV differential: when back-to-back pitches fall within 6 EvMPH of each other, hard-hit balls, defined as balls in play with exit velocities of 95 mph or greater, become substantially more likely. Husband placed the proportion at approximately 50%.
To test both claims, the team drew on Statcast data from Baseball Savant, covering the full 2017 to 2021 seasons. Husband provided a proprietary table of EV differentials measured at regular intervals in the strike zone; the team used it to build a function that matched his empirical EvMPH calculations to within 0.02 EvMPH. Jason Wilson, Ph.D., who led the project, had no financial relationship with Husband. The evaluation was conducted entirely independently.
What the Data Showed
The attention zone held across five seasons. Batting average, well-hit average, and home run percentage all peaked in the 91 to 93 EvMPH range. Swing-and-miss percentage reached its lowest point in the same band. The pattern appeared in each individual year and in the five-year aggregate, running as smooth, concave curves. The 2020 season, shortened to 60 games by the COVID-19 pandemic, showed more variance than the others, but the shape of the curve held.
The EV differential result came back at 58%. When consecutive pitches were within 6 EvMPH of each other, 58% of hard-hit balls resulted, exceeding Husband's own benchmark.
"Excited," Wilson said of the Phase 2 finding. "The 58% is actually more interesting than a clean 50% would have been. Working out why it wasn't closer to 50% took us deeper into the technical details of how Husband calculates EV. That's where you start to actually learn something."
Wilson described both results as strongly supported. The smooth, concave shape of the attention zone curves, stable across five seasons and 3.2 million pitches, pointed to a repeatable phenomenon in the data rather than a pattern specific to any single year.
The Research Behind the Research
The EV study did not arrive without context. It was the most data-intensive project in a decade of baseball analytics research Wilson built at Biola through the Research Assistant in Mathematics Program (RAMP), a paid undergraduate research program founded at the university in 2009. RAMP compensates students for faculty-led research work.
"It pays students for their research," Wilson said. "That might sound simple, but it changes everything. A student who gets paid for their math work doesn't have to spend evenings at a retail job to cover expenses. They can give that time to their career instead."
The baseball analytics thread started in 2015, when Wilson and RAMP student Josh Pixler co-invented the Quality of Pitch (QOP) statistic: a single score combining pitch trajectory, location, and speed, calculated from PITCHf/x data. QOP was presented at the 2015 SABR convention, the annual conference of the Society for American Baseball Research, and is cited in Wikipedia's Pitch Quantification article. The statistic gave Biola's team both a proprietary analytical tool and an established standing in the baseball research community.
"Through QOP, I built the background in sabermetrics, baseball analytics, that made the EV project possible," Wilson said. "What QOP taught us is that pitch quality and pitcher quality are different things. A great pitcher can regularly throw poor-quality pitches and still deceive hitters. That gap, how to quantify pitcher quality and not just pitch quality, is what we're trying to close. Working with Perry Husband on Effective Velocity was a chance to advance that problem while giving my students direct contact with one of the leading practitioners in the field."
Subsequent RAMP projects extended QOP's reach. Student Jeremiah Chuang contributed to QOP research and later, with Joseph Lane, used QOP to study pitch quality during MLB's home run surge of 2017 to 2019, finding that periods of record offensive output tracked with measurable declines in QOP scores. In 2020, Brian Zarske used QOP to identify sign-stealing patterns by the Houston Astros and Boston Red Sox, comparing pitch quality differences between home and road games. The EV evaluation followed, and was the largest project in the sequence.
What Students Get
The three lead contributors on the EV project were Chase Hwang and Mateo Langston-Smith, both members of the Spring 2022 Statistical Consulting Practicum. Seven additional students contributed to the engagement, for a total of nine.
"Real-world project experience, contact with an elite MLB pitching coach, and credentials," Wilson said. "The kind you can put in front of a hiring manager and point to something real."
Phase 3 of the collaboration is ongoing. The QCC is currently working to quantify Husband's pitch tunneling concept, which has resisted a clean mathematical formulation so far. The research thread from QOP to the EV evaluation to pitch tunneling has run continuously for more than a decade.
Work with the Quantitative Consulting Center
The Biola University Quantitative Consulting Center (QCC) takes on real statistical consulting projects for external clients throughout the academic year, including businesses, nonprofits, research institutions, and industry partners. Students scope each engagement, select the methods, and deliver findings the client can use.
Engage the QCC — If your organization has a data or statistics challenge, the QCC takes on external client projects.
Contact the QCC
Study Math at Biola — See the kinds of projects you could work on.
Explore the Mathematics Program