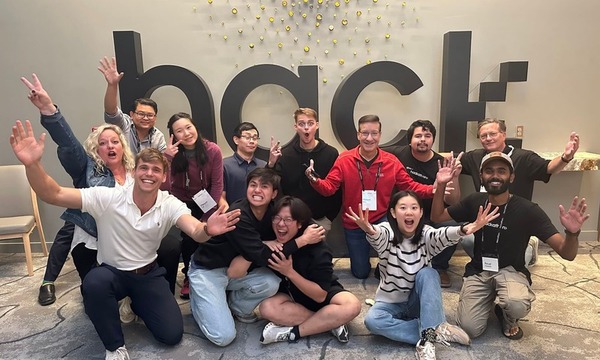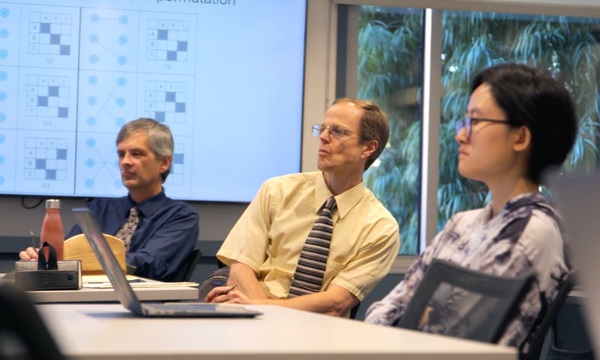
The call was camera-off. Every variable name on Megan Lai's screen had been stripped per government security policy. On the other end of the line were scientists from Lawrence Livermore National Laboratory, one of the country's principal facilities for national security research. Lai was a Biola University student. She was not an observer. She was part of the team.
Lai was one of three students working under Dr. Jason Wilson, director of Biola's Quantitative Consulting Center (QCC), on a live contract project with Lawrence Livermore (LLNL). The project ran through the Research Assistant in Mathematics Program (RAMP), a donor-funded program established in 2009 that pays Biola math and computer science majors to assist faculty on real research projects. The problem Lawrence Livermore brought to Biola: identify which manufacturing variables most influence the particle size and surface area of TATB, a critical material in the U.S. nuclear weapons stockpile.
What is TATB, and why does it matter?
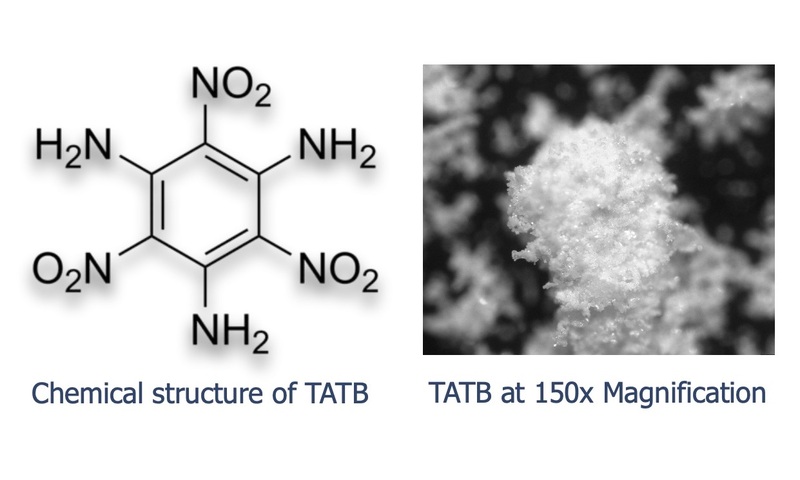
Triaminotrinitrobenzene, or TATB, is a highly stable insensitive high explosive used as the explosive ingredient in nuclear weapons compositions. It was first synthesized as a dye in 1888 and recognized as a high explosive in 1956. U.S. national laboratories can produce large particles and small particles, but controlling the full distribution of particle sizes and understanding which manufacturing inputs produce which outputs remains an open technical question with direct implications for weapons safety and precision.
Two Drivers in 43 Variables
The team analyzed 25 batches of TATB, 21 from a partner facility and four from LLNL itself, across 43 variables: 21 design inputs, 10 in-process measurements captured as time-series data over approximately 10 hours per batch, and 12 output measures. To find patterns in the time-series data, the team applied functional data analysis, a technique that compresses continuous measurements into a small set of high-information statistical components. They then built multiple and multivariate regression models to identify which variables drive surface area and particle size distribution.
The surface area model explained 89.3% of the variability in the data. Two variables emerged as the strongest predictors: rotational speed (RPM) and ammonia feed rate. An exhaustive model search, coded in R, evaluated 13,769 combinations of input variables, narrowed from more than 1.6 million possibilities. The results give LLNL a quantitative basis for designing future batches toward target specifications.
What the students brought home
Megan Lai came into the project expecting to use statistics. She did not expect to sit on a call with working national laboratory scientists and come away with a clearer picture of what a data science career could look like in practice.
"I got to apply advanced statistical methods to a real problem," she said, "and see how data science, chemistry, chemical engineering, fluid dynamics, and physics all come together in one place. Meeting the people at Lawrence Livermore and seeing the work up close made it feel like something I could actually pursue."
Easton Imes said RAMP gave him a foundation he expects to carry forward regardless of where his career leads. "It helped me build real team skills," he said. "I'd recommend it to anyone. Even if the project doesn't match your career path exactly, that real-world experience is what sets you apart later."
How Dr. Wilson ran it
Dr. Wilson brought his students into every stage of the project: background research, methodology development, the security-protocol calls with LLNL staff, and the final poster presentation. His goal was to give students the full arc of a professional engagement, not just the parts that are easy to supervise. Wilson said the students exceeded his expectations, and that the group came together as a research team in a way that made the work effective. He frames the approach in terms of First John 2:27: trusting that students who pursue their research with intellectual honesty and genuine curiosity will find their way to the truth in the data.
Explore research opportunities in the Quantitative Consulting Center.
Read another QCC project: Effective Velocity.